See the Pen PyScript / MatPlotLib and Chart.js Data Visualization by Alex Reeves (@a-p-reeves) on CodePen.
About this project
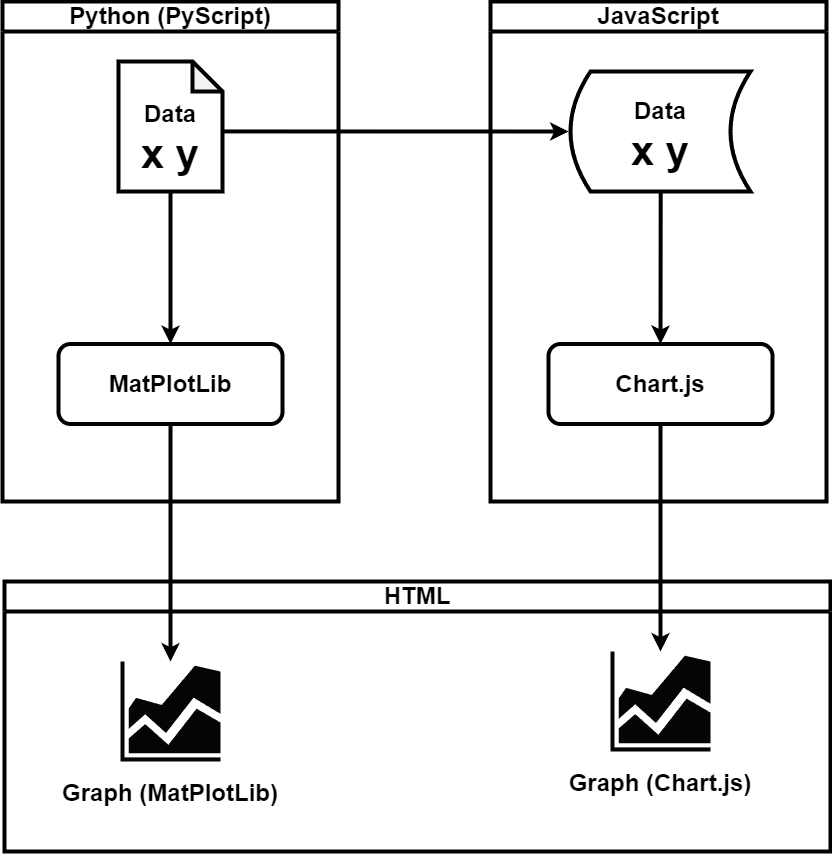
The goal of this project is to create an interface between python and javascript, to take advantage of python’s comuputational strengths, and combining it with the ease of use and interactivity of a html/javascript web-based interface. Specifically this could serve as a basis for running of complex python simulations using packages such as GEKKO directly within the browser.
This project contains multiple implementations:
PyScript:
Allows running of python code within the browser directly, as well as enables python package implementation.
Python MatPlotLib:
Allows for typical plotting of data which is returned via the PyScript function display().

Chart.js:
Offered as an alternative graphing solution, with the benefit of an animated vector-based output, and interactive data presentation on mouse-over. Note that the underlying data values are obtained directly from the python code via passing in between python and javascript using PyScript’s inbuilt functions.
Note: Currently javascript is executed via button, as it loads before PyScript is able to run. In the future this could be handled by running the javascript function at the end of the initial pyscript run.
[view on CodePen]